


The randomized controlled trial involved 51 female participants aged between 22 and 39 years old, all of whom provided informed written consent. Recruitment took place from February to April 2023. The study consisted of two assessment periods, baseline (T1) and post-intervention (T2), with measurements taken in April and May 2023, respectively. Random assignment to the EG and CG resulted in similar age distribution subsamples. To evaluate equity in socio-demographic variables between the two groups, independent t-tests were conducted for age and educational level. The results showed no significant differences, indicating sample equivalence for hypothesis testing. The study involved 26 female participants (n = 26) in the EGwith a mean age of 29.4 years (SD = 3.88), and 25 female participants (n = 25) in the CG with a mean age of 30.4 years (SD = 4.05) (refer to Table 1). No notable discrepancies were identified with regard to the participants’experiences with gratitude and compassion training, educational attainment, the number of children they had, their material circumstances or profession.
All 51 participants completed the questionnaires at both T1 and T2 due to regular reminder emails after the intervention, and there were no dropouts.
Perquisitions
Normal distribution could be assumed for both main scales and most sub-scales (p > 0.05), except for SCS Self-Kindness, MCGM-FOG, MCGM-EOG, and MCGM-AOG (Table). However, ANOVA is relatively robust in regard to normal distribution violation [61] Variance homogeneity could be assumed for all main scales and sub-scales, except for MCGM-AOG. In the case of the latter, the post hoc test was conducted in accordance with Holm. For all others, the post hoc test was conducted in accordance with Tukey.
Results of test for replication—self compassion
The study analyzed the changes over time in the main Self-Compassion Scale (SCS) and its six sub-scales, namely self-kindness, self-judgment, common humanity, isolation, mindfulness, and over-identification, between the EG and CG.
SCS—Complete
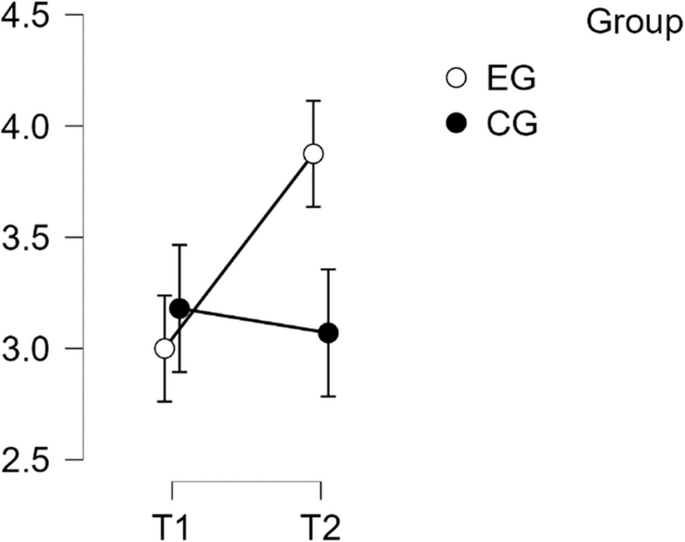
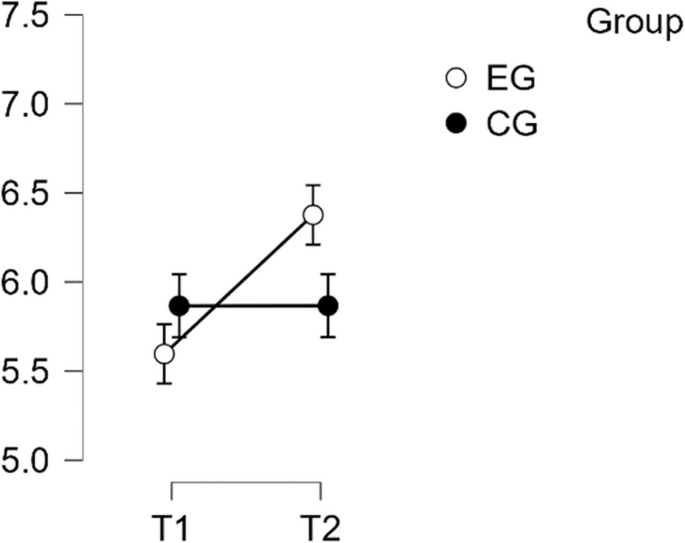
The analysis revealed that there was a normal distribution and variance homogeneity. A repeated measures ANOVA was conducted, which showed a statistically significant difference between mean performance levels across measurements, F(1,49) = 26.449, p < 0.001, partial η2 = 0.351. Additionally, there was a significant interaction effect between time and group on the primary SCS score scale, F(1,49) = 59.135, p < 0.001, η2p = 0.547. Post hoc tests confirmed significant implicit differences between the EG and the CG (t(51) = 4.527, p = 0.001, d = 1.268). The intervention resulted in a significant improvement of scores from T1 to T2 in the EG (t(26) = −9.164, p < 0.001), with a mean difference (MD) of −0.883 points and a 95% CI of [−1.148, −0.618], d = −1.288(refer to Table 2).
This effect size is considered large. Therefore, H1 is confirmed (refer to Fig. 1).

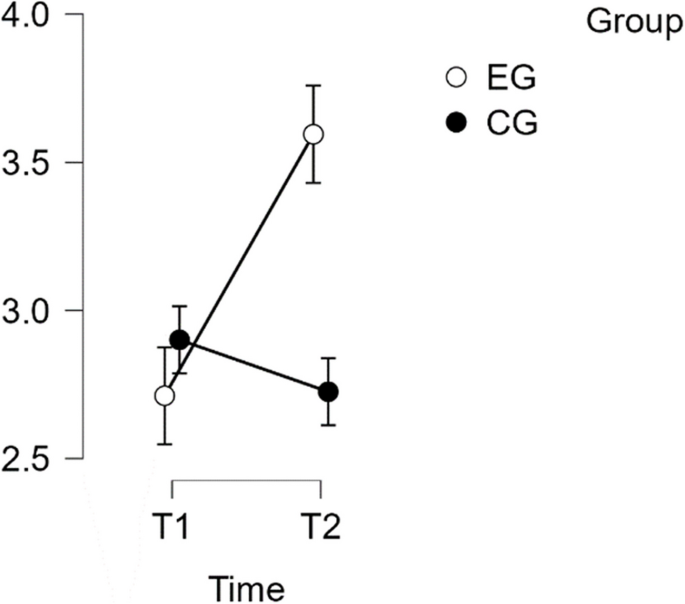
Estimated marginal means for Self-Compassion Subscale complete score
SCS self kindness subscale
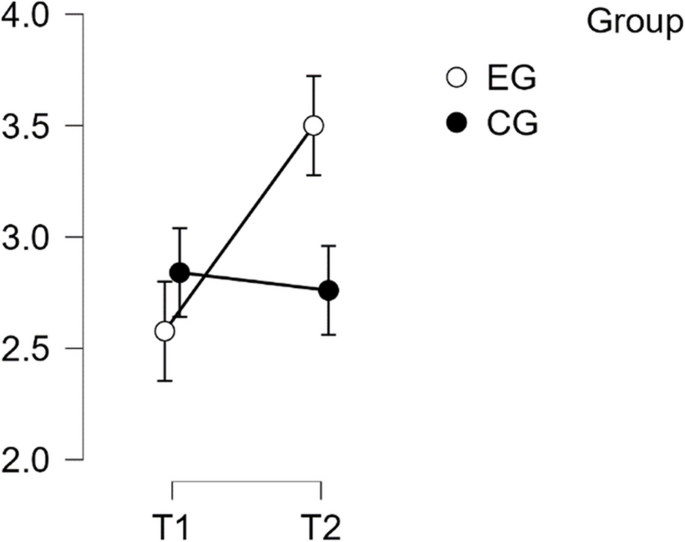
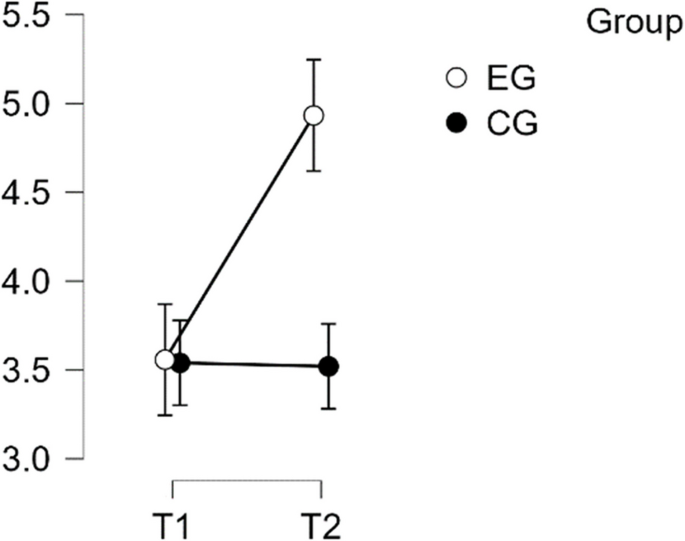
The analysis showed a violation of normal distribution and homogeneity of variance. The repeated measures ANOVA revealed a statistically significant difference in mean performance levels between measurements (F(1,49) = 23.185, p < 0.001, partial η2 = 0.321). The statistical significance of the interaction between time and group on the sub-scale Self-Kindness of the SCS score was confirmed (F(1,49) = 49.113, p < 0.001, η2p = 0.501). Post-hoc tests revealed significant implicit differences between the EG and CG groups (t(51) = 4.134, p = 0.001, d = 1.158). The intervention resulted in a noteworthy increase in scores from T1 to T2 in the EG. The difference was statistically significant, with t(26) = −8.443, p < 0.001 and a mean difference (MD) of −1.208 points, 95% CI [−1.601, −0.814], d = −1.277, indicating a large effect size (refer to Table 3).
These findings confirm H1 regarding Self Kindness (refer to Fig. 2).

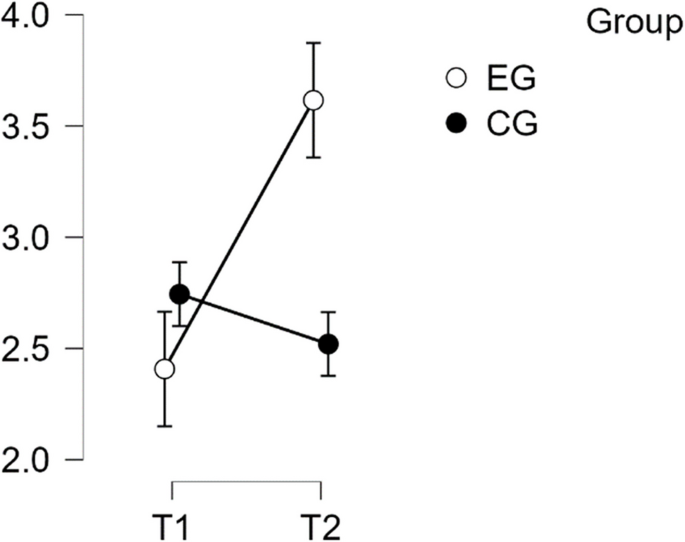
Estimated marginal means for self-compassion subscale self kindness
SCS—self judgement subscale
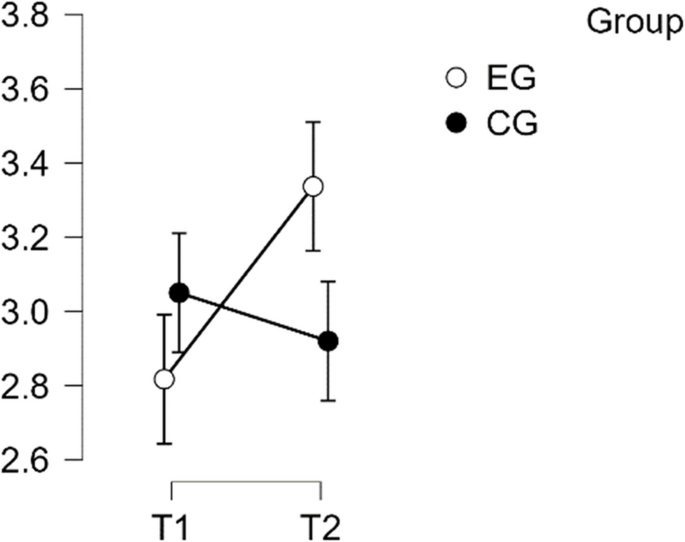
The analysis showed normal distribution and homogeneity of variance. The repeated measures ANOVA indicated a statistically significant difference in mean performance levels between measurements, F(1,49) = 17.373, p < 0.001, partial η2 = 0.262. The statistical significance of the time * group interaction on the Self-Judgement sub-scale of the SCS score was also confirmed, F(1,49) = 27.113, p < 0.001, η2p = 0.501. Post-hoc tests confirmed implicit differences between EG and CG (t(51) = 4.134, p = 0.001, d = 1.158). The intervention resulted in a significant increase in scores from T1 to T2 in EG (t(26) = −6.695, p < 0.001) with a mean difference (MD) of −0.938 points, 95% CI [−1.324, −0.553], d = −1.081, which is considered a large effect (See Table 4).
Therefore, H1 was confirmed in regards to Self Judgement (see Fig. 3).
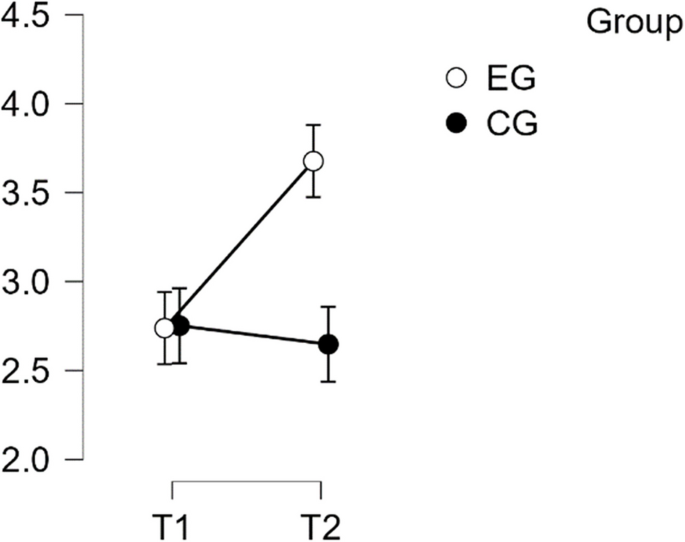
Estimated marginal means for self-compassion subscale self-judgement
SCS—common humanity subscale
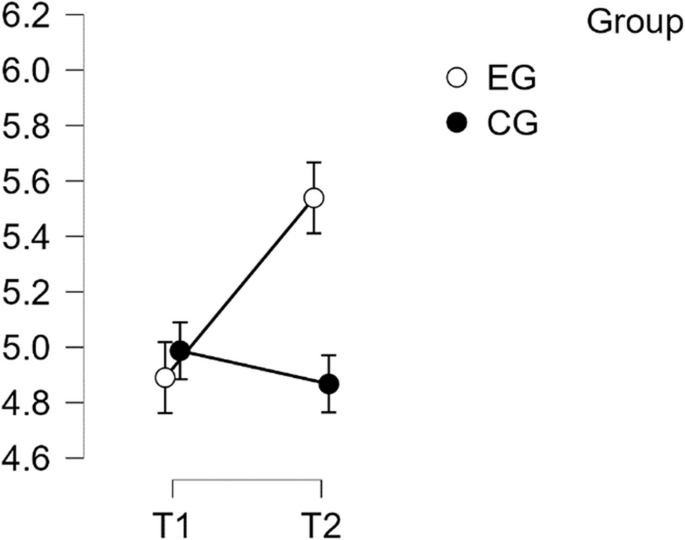
The analysis showed normal distribution and homogeneity of variance. The repeated measures ANOVA indicated no statistically significant difference in mean performance levels between measurements, F(1,49) = 3.733, p = < 0.059, partial η2 = 0.071. However, the time * group interaction on the sub-scale Common Humanity of the SCS score was found to be statistically significant, F(1,49) = 32.856, p = < 0.001, η2p = 0.401. Post-hoc tests showed significant implicit differences between the EG and the CG (t(51) = 5.218, p = 0.001, d = 1.462). The intervention resulted in a significant increase in scores from T1 to T2 in the EG (t(26) = −5.473, p < 0.001), with a mean difference (MD) of −0.827 points, 95% CI [−1.242, −0.411], d = −1.072, indicating a large effect (refer to Table 5).
Therefore, H1 was confirmed regarding Common Humanity (see Fig. 4).
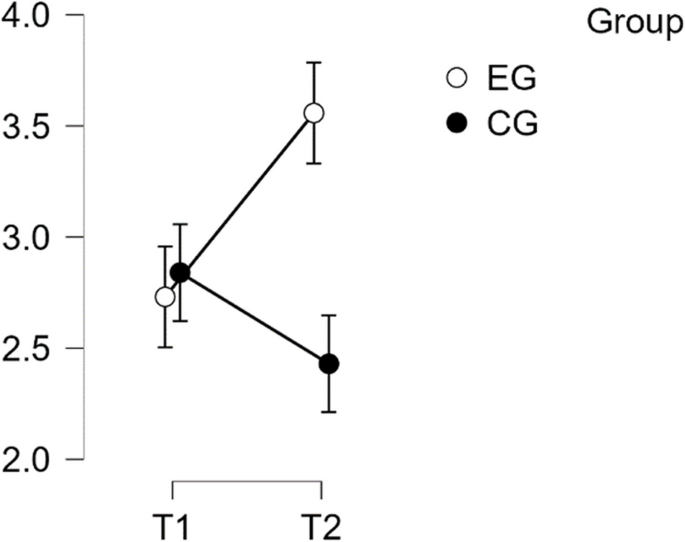
Estimated marginal means for self-compassion subscale common humanity
SCS – isolation subscale
The analysis showed that the distribution was normal, and the variance was homogeneous. The repeated measures ANOVA revealed a statistically significant difference in mean performance levels between measurements (F(1,49) = 9.043, p < 0.004, partial η2 = 0.154). The statistical significance of the interaction between time and group on the sub-scale Isolation of the SCS score was also determined (F(1,49) = 14.992, p < 0.001, η2p = 0.234). Post-hoc analysis confirmed significant differences between the EG and the CG (t(51) = 2.859, p = 0.028, d = 0.801). The intervention resulted in a significant improvement in scores from T1 to T2 within the EG (t(26) = −4.913, p < 0.001). The mean difference (MD) was −0.875 points, 95% CI [−1.365, −0.385], d = −0.870, indicating a large effect (refer to Table 6).
Therefore, H1 was confirmed in regards to Isolation (see Fig. 5).
Estimated marginal means for self-compassion subscale isolation
SCS – mindfulness subscale
The statistical analysis showed that the distribution was normal and the variance was homogeneous. The repeated measures ANOVA showed a statistically significant difference in mean performance levels between measurements (F(1,49) = 16.791, p = < 0.001, partial η2 = 0.255). An interaction between time and group was observed for the’Mindfulness’subscale of the SCS score (F(1,49) = 23.769, p < 0.001, η2p = 0.327). Post-hoc analysis revealed significant differences between the EG and the CG (t(51) = 3.148, p = 0.013, d = 0.882). The intervention resulted in a significant increase in T2 scores in the EG, t(26) = −6.408, p < 0.001, MD of −0.923 points, 95% CI [−1.319, −0.527], d = −1.100, representing a large effect size (refer to Table 7).
Hypothesis H1 was confirmed concerning Mindfulness (see Fig. 6).
Estimated marginal means for self-compassion subscale mindfulness
SCS—over identification subscale
The analysis showed a normal distribution and even variance. The repeated measures ANOVA revealed a statistically significant difference in mean performance levels between measurements (F(1,49) = 5.732, p = 0.021, partial η2 = 0.105). The statistical significance of the interaction between time and group on the Over-Identification subscale of the SCS score was also established (F(1,49) = 15.948, p < 0.001, η2p = 0.246). However, the post-hoc tests did not confirm any inherent differences between the EG and the CG (t(51) = 2.222, p = 0.127). Nevertheless, the intervention resulted in a substantial improvement in scores from T1 to T2 in the EG. The statistical analysis showed a significant increase, t(26) = −4.562, p < 0.001, with a mean difference (MD) of −0.519 points, 95% CI [−0.832, −0.206], d = −0.776, indicating a large effect size (see Table 8).
Hypothesis H1 was only partially confirmed regarding Over-Identification (see Fig. 7).
Estimated marginal means for self-compassion subscale over identification
Results of test for replication – gratitude
The study analyzed the divergence between the EG and CG over time in relation to the primary Multi-Component Gratitude Measure (MCGM) scale and its six sub-scales: Feelings of gratitude (FOG), Attitudes to appropriateness (ATA), Behavioral shortcomings (BS), Rituals/Noticing benefits (RNB), Expression of gratitude (EOG), and Attitude of gratitude (AOG).
MCGM – complete
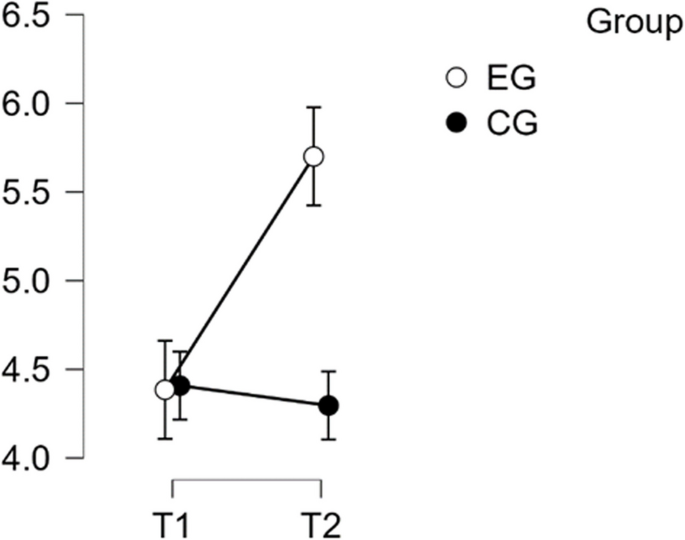
The analysis showed that the distribution was normal and the variance was homogeneous. The repeated measures ANOVA revealed a statistically significant difference in mean performance levels between measurements (F(1,49) = 21.946, p < 0.001, partial η2 = 0.309). The statistical significance of the interaction between time and group on the primary scale MCGM score was also established (F(1:49) = 46.287, p < 0.001, η2p = 0.486). Subsequent post-hoc assessments confirmed the inherent disparities between the EG and the CG (t(51) = 4.113, p < 0.001). The intervention resulted in a noteworthy increase in scores from T1 to T2 in the EG, t(26) = −8.204, p < 0.001, with a mean difference (MD) of −0.648 points, 95% CI [−0.866, −0.431], d = −1.113 (see Table 9).
This outcome is classified as a large effect, confirming Hypothesis H2 (see Fig. 8).

Estimated marginal means for multi-component gratitude measure scale total
MCGM – FOG subscale: feelings of gratitude
The normality of the distribution was violated, and variance homogeneity was confirmed in the analysis. The repeated measures ANOVA revealed a statistically significant difference in mean performance levels between measurements, F(1,49) = 22.021, p < 0.001, partial η2 = 0.310. An interaction between time and group was detected in the FOG subscale of the MCGM, F(1,49) = 21.931, p < 0.001, η2p = 0.309. However, the post-hoc tests did not reveal any significant differences between the EG and the CG, t(51) = 1.998, p = 0.200. The intervention resulted in a noteworthy improvement in scores for the EG from T1 to T2, t(26) = −6.696, p < 0.001 with a mean difference (MD) of −0.781 points, 95% CI [−1.101, −0.460], d = −0.857, which is characterized as a large effect (refer to Table 10).
Therefore, hypothesis H2 was only partially confirmed in gegards to the FOG Subscale (see Fig. 9).

Estimated marginal means for multi-component gratitude measure subscale feelings of gratitude
MCGM – ATA subscale: attitudes to appropriateness
The analysis was used to determine the normality of distribution and homogeneity of variance. In relation to the MCGM sub-scale ATA, there was no statistically significant interaction between time and group (F(1:49) = 1.582, p = 0.214, η2p = 0.031). Therefore, hypothesis H2b was not confirmed.
MCGM – BS subscale: behavioral shortcomings
The analysis showed that there was a normal distribution and homogeneity of variance. The statistical significance of the interaction between time and group on the sub-scale BS was confirmed (F(1:49) = 26.336, p < 0.001, η2p = 0.350). Post-hoc tests confirmed significant differences between the EG and the CG (t(51) = 3.871, p = 0.001). The intervention resulted in a significant improvement in scores from T1 to T2 in the EG, t(26) = −7.225, p < 0.001, with a mean difference (MD) of −1.375, 95% CI −1.898 to −0.852, d = −1.056, indicating a large effect size (refer to Table 11).
Thus, Hypothesis H2 was confirmed regarding the BS subscale (see Fig. 10).
Estimated marginal means for multi-component gratitude measure subscale behavioral shortcoming
MCGM – RNB subscale: rituals/noticing benefits
The analysis showed that there was a normal distribution and equal variance among the groups. The statistical significance of the time * group interaction was established on the RNB subscale, with F(1:49) = 37.667, p < 0.001, η2p = 0.435. The implicit differences between the EG and the CG were subsequently confirmed through post-hoc tests, with t(51) = 5.054, p < 0.001. The intervention resulted in a significant increase in scores from T1 to T2 in the EG, t(26) = −8.078, p < 0.001, with a mean difference (MD) of −1.315 points, 95% CI [−1.763, −0.868], and a large effect size (d = −1.326) (refer to Table 12), confirming Hypotheses H2 regarding the subscale RNB (refer to Fig. 11).
Estimated marginal means for Multi-Component Gratitude Measure Subscale Rituals/Noticing benefits
MCGM – EOG subscale: expression of gratitude
The analysis showed a violation of normal distribution and confirmation of homogeneity of variance. The statistical significance of the interaction between time and group on the EOG subscale was F(1:49) = 4.040, p = 0.050, η2p = 0.076. However, post-hoc tests did not confirm any differences between the EG and the CG (t(51) = 2.491, p = 0.069). Additionally, the intervention did not result in a significant increase in scores from T1 to T2 in the EG (t(26) = −1.560, p = 0.410). Therefore, Hypothesis H2 was not confirmed regarding EOG (see Table 13).
MCGM – AOG subscale: attitude of gratitude
Upon analysis, it was found that normality of distribution and homogeneity of variance were violated. The statistical insignificance of the interaction between time and group on the sub-scale AOG (F(1:49) = 3.979, p = 0.052) implies that hypothesis H2 was not confirmed in regards to AOG.
Results of test for replication – correlation of compassion and gratitude
In addition to the two main hypotheses, we analysed the correlation between the two scales. The Shapiro–Wilk test for bivariate variability suggested normal distribution. The SCS and MCGM were found to be highly positively correlated, with r(49) = 0.74, p < 0.001 (refer to Table 14 and Fig. 12).

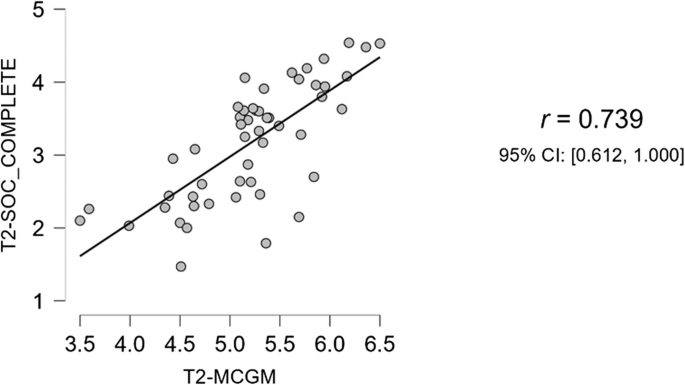
Correlation between self-compassion scale and multi-component gratitude measure scale complete
link